Arquitectura de la plataforma
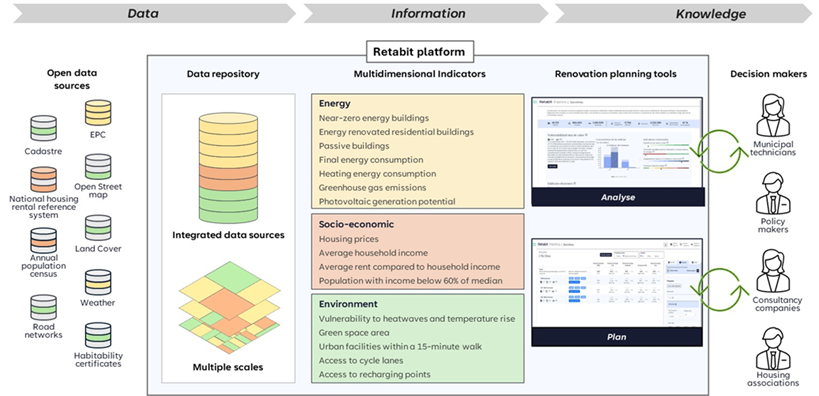
Retabit és una plataforma centrada en dades que facilita la integració de la rehabilitació d’edificis dins d’estratègies més àmplies de regeneració urbana, combinant indicadors energètics, econòmics i socials en un sistema unificat. A partir de fonts de dades públiques, proporciona als municipis informació accionable que vincula els projectes de rehabilitació amb les agendes de transformació urbana i climàtica.
Les dades de diverses fonts públiques de Catalunya, que abasten diversos àmbits com el cadastre, els censos, el rendiment energètic i la informació geoespacial, s’integren a la plataforma. Aquestes dades serveixen de base per a una sèrie d’indicadors que capturen les característiques dels edificis en el context més ampli del seu entorn urbà, dinàmica social i situació econòmica.
Integració de dades
La plataforma Retabit utilitza un enfocament sòlid basat en dades per donar suport a la presa de decisions informades. Integra 11 conjunts de dades principals, amb més de 15 milions de registres, que cobreixen edificis, infraestructures, rendiment energètic, factors ambientals i indicadors socioeconòmics (veure Taula 1).
| Fonts de dades | Escala | Àmbit | Proveïdor | Núm. de registres |
|---|---|---|---|---|
| Catastre - edificis | Edifici | Altres | Ministeri d’Hisenda, Espanya | 1,396,004 |
| Catastre - propietats | Edifici | Altres | Ministeri d’Hisenda, Espanya | 6,742,293 |
| Xarxes viàries | Urbà | Altres | Institut Geogràfic Nacional, Espanya | 1,147,000 |
| Certificats d’habitabilitat | Habitatge | Altres | Departament de Territori, Habitatge i Transició Ecològica, Espanya | 3,058,727 |
| Certificats d’eficiència energètica | Edifici | Energia | ICAEN, Generalitat de Catalunya | 1,322,334 |
| Cartografia de l’Atles Climàtic | Urbà | Ambiental | Departament d’Agricultura, Ramaderia, Pesca i Alimentació, Generalitat de Catalunya | 179 |
| Open Street Maps (equipaments) | Edifici | Ambiental | ©Contribuïdors d’OpenStreetMap | 31,874 |
| Mapa de cobertes del sòl | Urbà | Ambiental | Institut Cartogràfic i Geològic de Catalunya | 1,526,984 |
| Model digital d’elevacions | Urbà | Ambiental | Institut Cartogràfic i Geològic de Catalunya | 267 |
| Sistema estatal de referència del lloguer d’habitatge | Secció censal | Socioeconòmic | Ministeri d’Habitatge i Agenda Urbana, Espanya | 5,081 |
| Cens anual de població 2021–2024 | Secció censal | Socioeconòmic | Institut Nacional d’Estadística, Espanya | 36,334 |
Les dades es recullen regularment de fonts fiables com ara els registres cadastrals nacionals, els certificats d’eficiència energètica i les dades censals, mitjançant un procés automatitzat d’Extracció-Transformació-Càrrega (ETL) desenvolupat en Java i Python. Durant el processament, les dades es netegen, s’harmonitzen i s’alineen espacialment utilitzant el sistema de coordenades ETRS89-UTM31N, garantint-ne la coherència entre capes.
El sistema manté una estricta integritat relacional en una base de dades PostgreSQL/PostGIS i serveix les capes geoespacials mitjançant GeoServer amb total interoperabilitat per a aplicacions GIS i BIM.
La plataforma també enriqueix les dades dels edificis amb descriptors geomètrics i utilitza tècniques d’aprenentatge automàtic (XGBoost) per imputar valors absents amb gran precisió (R² > 0,85). Tot el flux de treball és codi obert, controlat per versions i completament auditable, garantint la transparència i la reproductibilitat.
Indicadors multidimensionals
Una revisió sistemàtica de la literatura acadèmica i grisa va identificar estudis locals i regionals rellevants, seleccionant vuit estudis de cas detallats (p. ex., Barcelona, Los Angeles) per a la comparació. Els indicadors d’aquests casos es van contrastar amb els Objectius de Desenvolupament Sostenible (ODS) per assegurar la seva rellevància, alineació amb múltiples metes, connexió amb els Plans d’Acció pel Clima i l’Energia Sostenible (PAES), aplicabilitat a la rehabilitació residencial i disponibilitat de dades obertes i detallades.
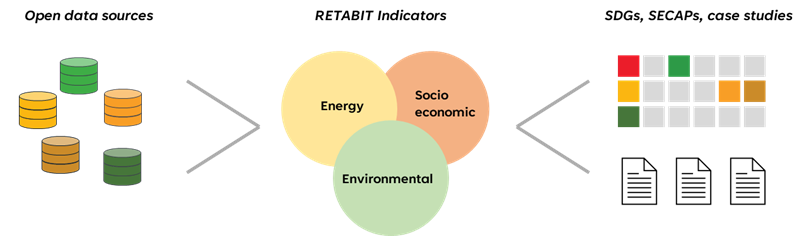
D’un total inicial de 745 indicadors, 114 van complir aquests criteris i es va identificar un conjunt harmonitzat de 16 indicadors a nivell d’edifici, agrupats en tres àmbits:
Energia
Edificis de consum gairebé nul (nZEB)
Aquest indicador identifica edificis classificats com a edificis de consum gairebé nul (nZEB) segons el Codi Tècnic de l’Edificació (CTE) a Espanya i alineats amb la Directiva 2010/31/UE.
Edificis residencials rehabilitats energèticament
Aquest indicador identifica edificis residencials existents que, després d'una rehabilitació, aconsegueixen un consum d’energia primària no renovable prou baix per ser considerats eficients segons el CTE.
Edificis passius
Aquest indicador identifica edificis residencials amb una demanda anual calculada de calefacció i refrigeració igual o inferior a 15 kWh/m²·any.
Consum energètic final
Aquest indicador quantifica l’energia final total (kWh/m²·any) consumida per un edifici i no generada per fonts renovables in situ.
Consum energètic per a calefacció
Aquest indicador quantifica el consum total d’energia primària no renovable dedicat exclusivament als sistemes de calefacció d’un edifici, expressat en kWh/m²·any de superfície útil climatitzada.
Emissions de CO₂
Aquest indicador quantifica la petjada de carboni operativa d’un edifici, expressada en kg de CO₂ emesos per m² de superfície útil climatitzada i any.
Potencial de generació fotovoltaica
Aquest indicador estima la producció elèctrica anual que un edifici podria generar mitjançant un sistema fotovoltaic a la seva coberta, expressada en kWh/m²·any de superfície de coberta.
Socioeconòmic
Preus de l’habitatge.
Aquest indicador recull el preu mitjà de lloguer per metre quadrat (€/m²) dels habitatges dins de cada edifici residencial.
Renda mitjana per llar.
Aquest indicador representa la renda neta anual mitjana de les persones que resideixen en una llar, expressada en euros (€), calculada per al conjunt de llars d’un edifici determinat.
Percentatge de lloguer respecte a la renda.
Aquest indicador econòmic quantifica el percentatge (%) de la renda mitjana per llar que s’hauria de destinar al pagament del lloguer.
Població amb ingressos inferiors al 60 % de la mediana.
Aquest indicador mesura la proporció de residents en cada edifici els ingressos dels quals situen la seva llar per sota del llindar de pobresa.
Ambiental
Vulnerabilitat a onades de calor i augment de temperatura.
Aquest indicador avalua el nivell de vulnerabilitat dels edificis davant esdeveniments extrems de calor, com les onades de calor i l’increment de les temperatures estivals, en una escala de 0 a 9.
Superfície de zones verdes.
Aquest indicador quantifica l’àrea total d’espais verds, expressada en hectàrees, dins d’un radi de 400 metres al voltant d’un edifici.
Equipaments urbans a 15 minuts a peu.
Aquest indicador mesura el nombre d’equipaments diferents ubicats a una distància equivalent a 15 minuts caminant des d’un edifici.
Accés a carrils bici.
Aquest indicador mesura la presència d’infraestructures ciclistes accessibles a peu des dels edificis residencials.
Accés a punts de recàrrega.
Aquest indicador avalua la disponibilitat i adequació de la infraestructura de recàrrega per a vehicles elèctrics (VE) a prop dels edificis residencials.